


Projects Port Data Visualisation
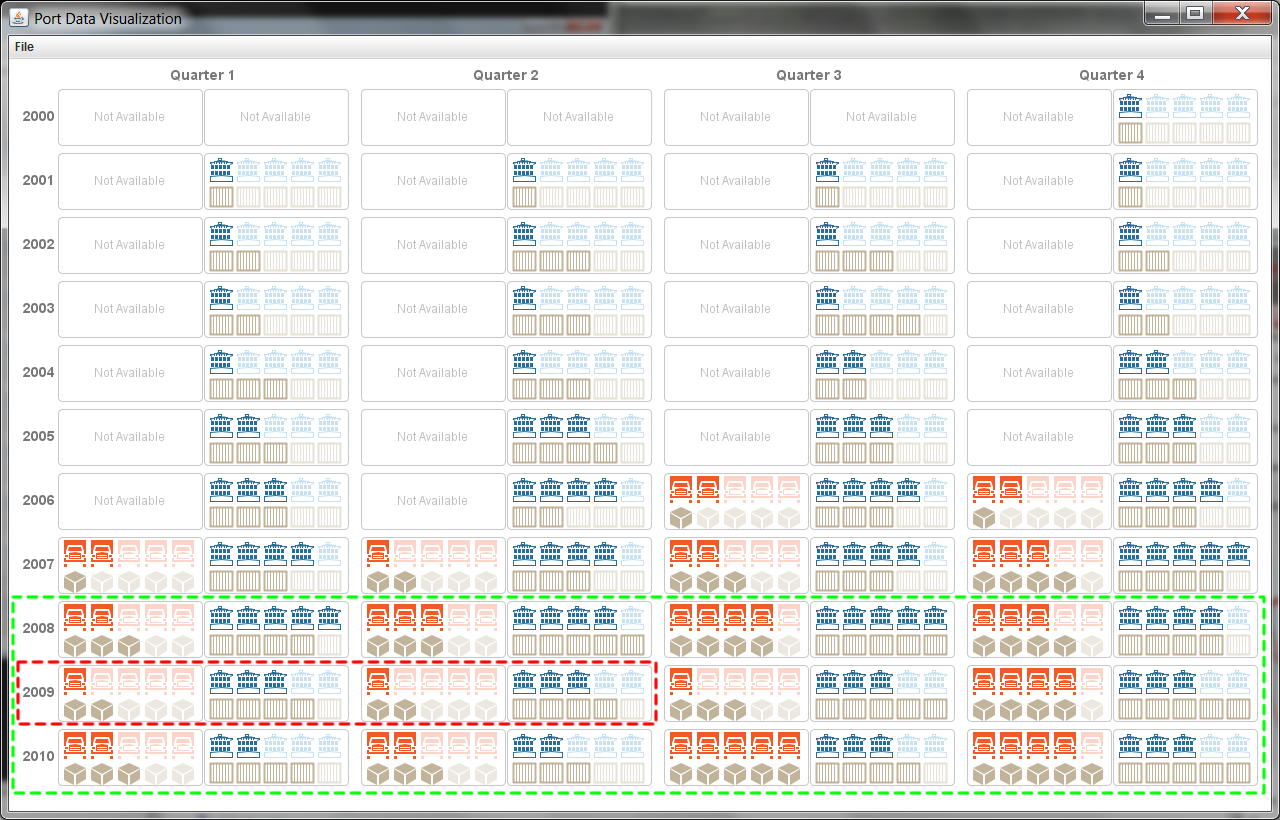
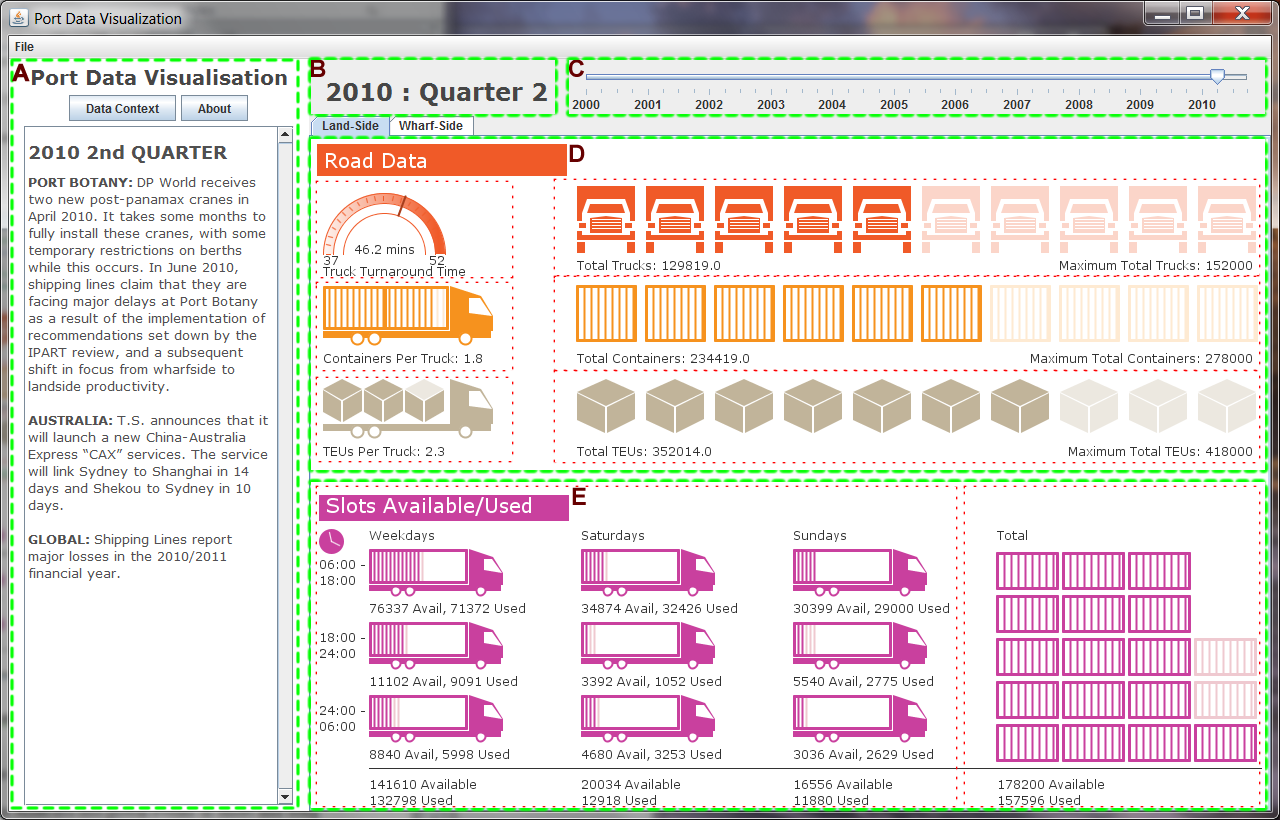
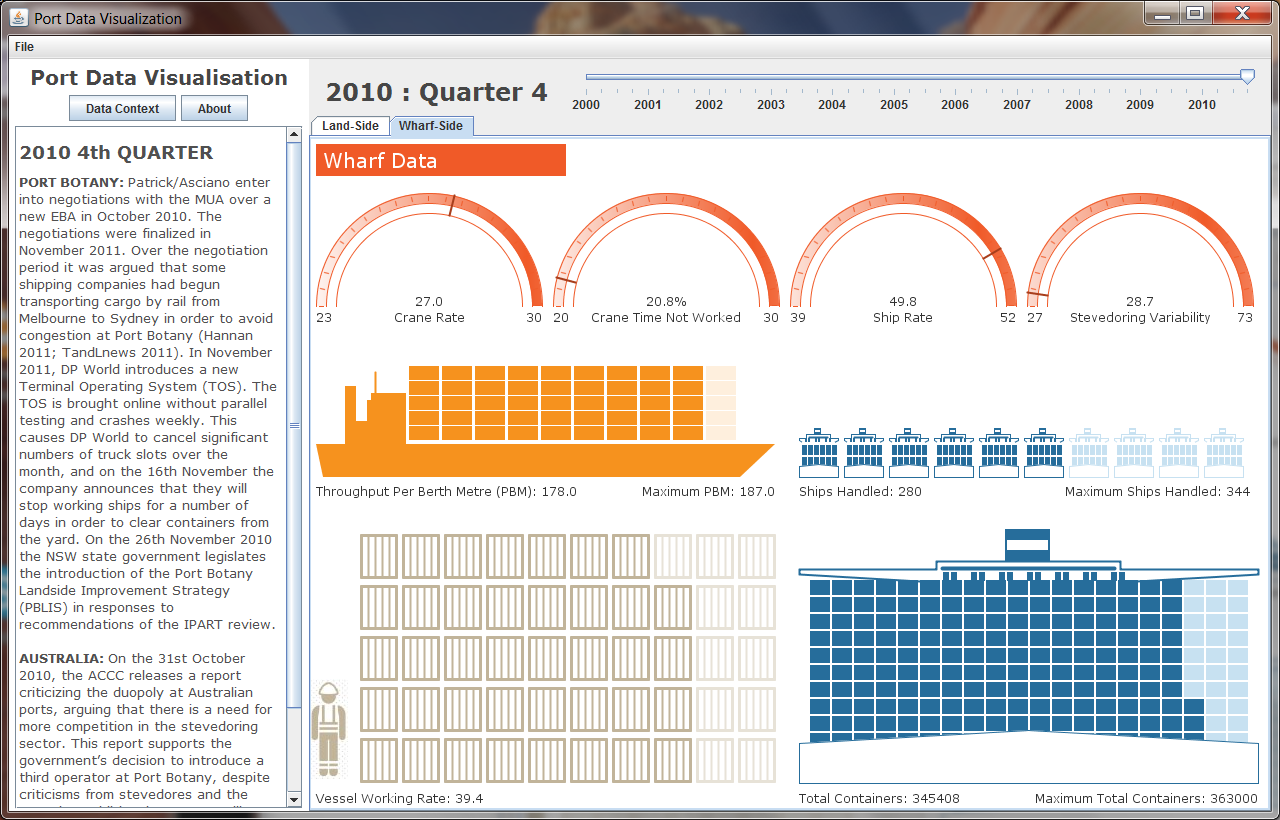
This project is a "proof-of-concept" prototype that used diagrammatic visualization for presenting multi-dimensional port data, in relation to local and global events. The visualization emphasizes relations between land-side and wharf-side elements and thus conveys derivable knowledge on labor productivity and efficiency. It can be used to convey commodity flows through the port and state, modes of transport, facilities and their capacities, operational characteristics, intermodal operations, and parameters required for calculating system efficiency, benefits and costs.
Sorfware and source code are available for downloading at: SourceForce (https://sourceforge.net/projects/tabuvis/files/?source=navbar).
Copyright © by Dr. Quang Vinh Nguyen, all rights reserved. Permission to use, copy, modify, and/or distribute this software for non-commercial use without fee is hereby granted, provided that the above copyright notice and this permission notice appear in all copies.
Publication(s)
Nguyen, Q. V., Zhang, K., and Simoff, S. (2015) Unlocking the Complexity of Port Data with Visualization. IEEE Transactions on Human Machine Systems, 45(2), pp. 272-279.
 |
 |
 |
